What It Does
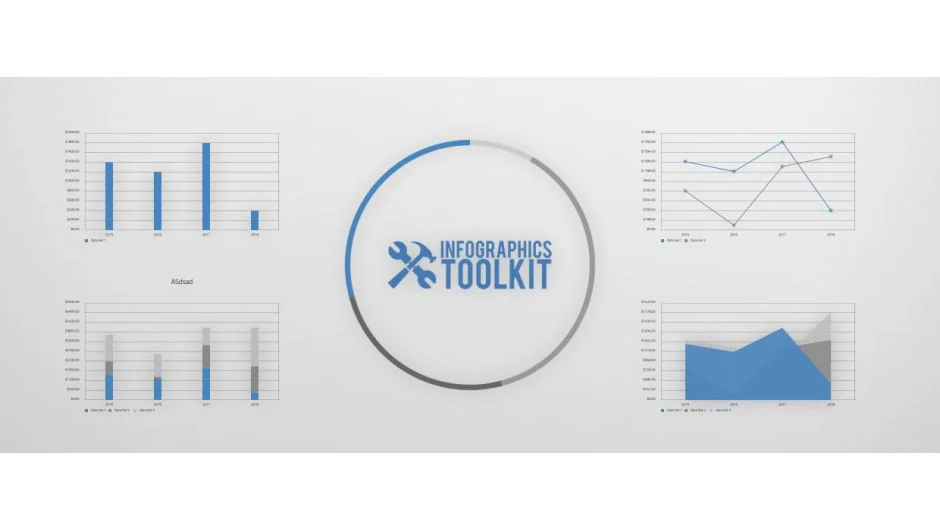
Infographics Toolkit builds complete data-driven presentations from spreadsheet input. Import data from CSV files or type it directly, select a visual style, and the toolkit generates animated charts with matching logo animations, transitions, and backgrounds. The Automatic Final Builder assembles everything into a ready-to-render composition.
Note: This product has been discontinued and is no longer available for purchase.
Key Features
Theme Layer system. Every chart, logo intro, and outro connects to a central Theme Layer through expressions. Change colors, timing, or data values in one place without touching individual keyframes. The entire presentation updates automatically.
Automatic Final Builder. Press one button to compile your logo intro, all charts, logo outro, transitions, and styled backgrounds into a single composition. Add or remove charts, then rebuild the final comp instantly.
Multiple visual styles. Each included style has unique intro/outro animations and chart designs, not just different colors. New styles could be downloaded through the built-in update system.
Spreadsheet integration. Load data from CSV files or enter it directly. Charts update automatically when source data changes.
Who It’s For
Useful for studios producing recurring data presentations, annual reports, or client pitches that need consistent branding across multiple chart types. The expression-driven system works well when you need to version presentations with different datasets.
Pricing
Originally sold for $149.99 (regular price) or $112.50 (sale price) as a one-time purchase. The product is now discontinued and no longer available.
Compatible with After Effects CS6 through CC 2015. Final version was 1.04, released October 2016.