What It Does
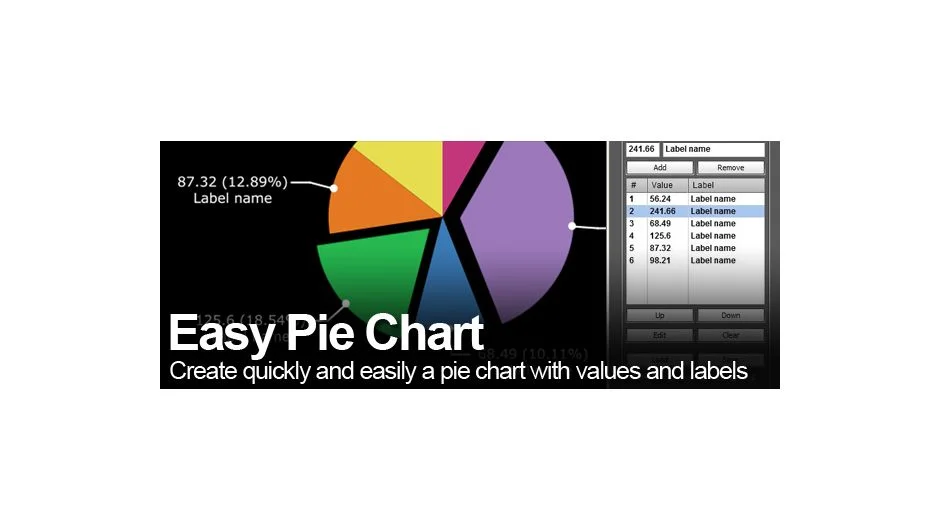
Easy Pie Chart generates animated pie charts in After Effects through a list-based interface. You input values and labels through a palette, then the script builds the chart with animated slices, pointer lines, and text labels. It accepts CSV, TXT, or XML file imports for batch data entry.
Key Features
List management controls. Add, remove, reorder, edit, or clear items from the palette. No limit on the number of values beyond chart readability.
Radius customization. Adjust inner radius (for donut charts), outer radius, and label distance from the circle. The latest version removed the 0-100 constraint on radius values, giving you full control over sizing.
Staggered line animations. Label pointer lines appear sequentially rather than simultaneously. You can also adjust the intro animation starting value for each pie slice.
Clockwise or counterclockwise. Control the direction the chart builds from the starting point.
Expression-based. The script generates compositions using expressions, making the charts easy to edit after creation. Colors are randomly assigned but fully editable.
Who It’s For
Useful for data visualization work, explainer videos, or any project where you need to show proportional data. The CSV import feature speeds up workflows when working with external datasets or client-provided spreadsheets.
Pricing
This plugin has been discontinued and is no longer available for purchase. It previously operated on a pay-what-you-want model where users could name their own price.
Last updated in May 2017 (version 1.1). Compatible with After Effects CS4 through CC 2018. Not tested for CC 2019 or later versions.